Average Returns and Retirement Risk
The Danger of Being Financially Average in Retirement

Average Returns, Unaverage Consequences: The Retirement Gravity Trap
Most people do not intentionally choose an average financial life.
They simply follow familiar rules:
“Stay invested.”
“The market always comes back.”
“You’re diversified.”
“Don’t worry about the downturn.”
“Seven percent should be enough.”
Those statements may sound reasonable. But retirement does not happen inside an average. It happens through a sequence of actual years: some favorable, some painful, and some arriving precisely when withdrawals begin.
That is the danger of being financially average.
A historical market average may look attractive on paper while your actual retirement income remains uncertain, exposed, and vulnerable to financial gravity.
Average return is not average retirement income
A long-term stock-market average is often quoted in the range of 6% to 10%, depending on the index, period, and calculation method. A roughly 10% historical S&P 500 average can be a useful reference point, but it is not a yearly promise. Review Fidelity’s discussion of retirement risks for a broader explanation of why actual returns vary.
The market does not deposit 10% into your account every year.
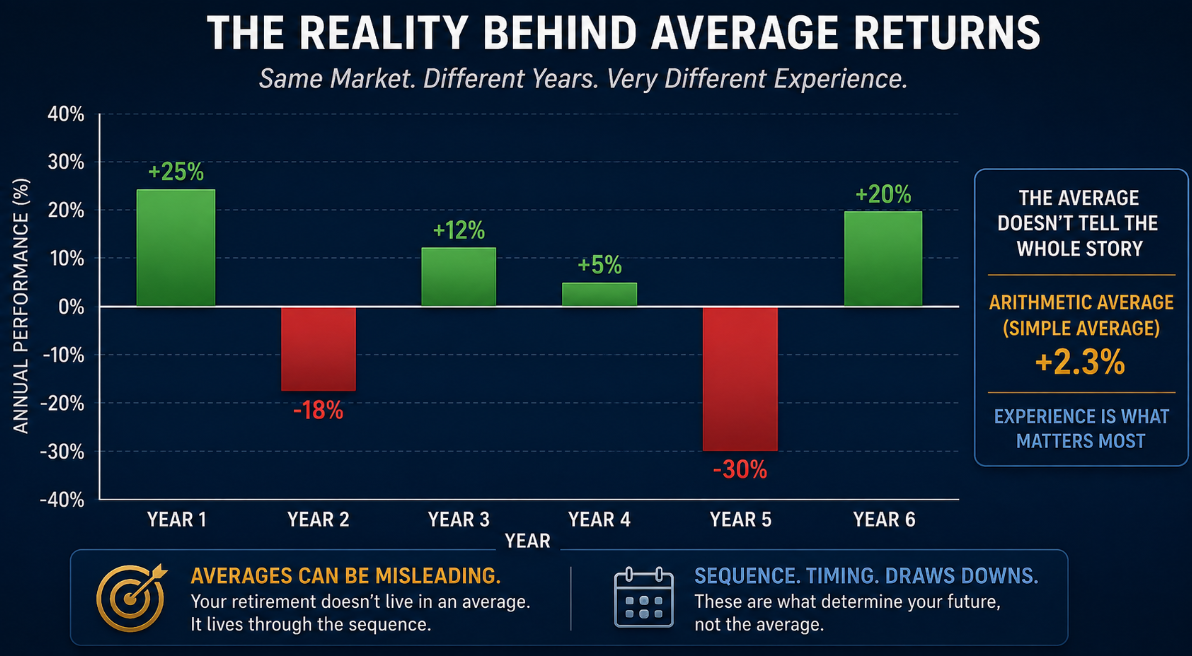
Your experience might look more like:
+25%
−18%
+12%
+5%
−30%
+20%
The arithmetic average may eventually look acceptable. The path may still damage your retirement.
That distinction matters because retirees are not merely accumulating assets. They are converting a balance sheet: the source of funds: into an income statement: the use of funds.
The margin between those two is the battleground.
Ask the more important question:
> What is the maximum lifetime income your assets can produce while preserving the greatest amount of generational wealth?
Do not answer that question with an average return alone.
Financial Gravity: three different forces
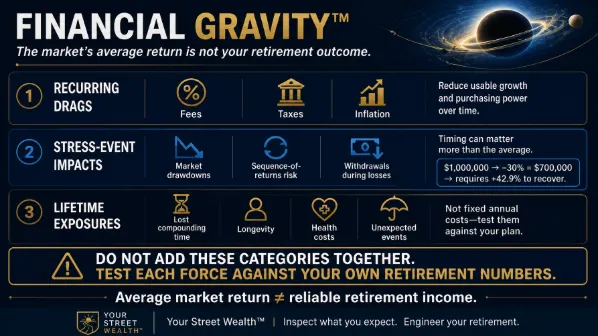
Financial Gravity™ is not one fixed annual loss. It is a way to inspect the forces that can reduce, interrupt, or delay the usefulness of your wealth.
Do not add the categories together. Test each one against your own retirement numbers.
Recurring drags
These occur repeatedly and reduce usable growth or purchasing power:
Fees
Taxes
Inflation
A 0.5% or 1% fee may look small in one year. Over decades, however, it removes capital that could have continued compounding. Taxes may arrive at different times and rates. Inflation can quietly increase the income required to maintain the same lifestyle.
These are not identical risks, and their effects depend on your account types, tax situation, spending, and income design.
Stress-event impacts
These are not annual expenses. They are events whose timing can matter more than the average:
Market drawdowns
Sequence-of-returns risk
Withdrawals during losses
Consider the simple recovery math:
Starting portfolio: $1,000,000
Market decline: −30%
Remaining portfolio: $700,000
Required recovery: approximately +42.9%
A 30% loss does not require a 30% gain to recover. The gain must be measured against the smaller remaining balance.
And that is before withdrawals.
If you sell investments to fund retirement while prices are down, fewer assets remain to participate in the recovery. This is sequence-of-returns risk: the order of returns can materially affect the outcome when withdrawals are occurring.
The Society of Actuaries retirement risk research and Center for Retirement Research analysis both underscore why retirement planning cannot rely on averages alone.
Lifetime exposures
Some consequences are not properly expressed as annual costs:
Lost compounding time
Longevity
Health and long-term-care costs
Unexpected events
Money can sometimes be recovered. Time never does.
Every year spent recovering from a major loss is a year that is no longer compounding toward income, independence, or legacy.
The Shiny Object and the Dark Object
The Shiny Object is the attractive number:
> “The market averages 7% to 10%.”
The Dark Object is everything the average may fail to reveal:
Cumulative cycle losses
Fees and taxes
Inflation
Sequence risk
Lost time
Unsecured income
Withdrawals during downturns
No one can prove in advance that future market gains will exceed every loss, leak, tax, fee, and timing problem your retirement may experience.
That is why “average return” is not a retirement plan. It is an assumption that must be tested.
Your Street Wealth calls this Participation vs. Engineered Performance.
Participation says, “I hope the market provides what I need.”
Engineered Performance asks, “What must each dollar do, what can cause it to fail, and how do I protect the margin?”
The Wall Street Cycle and the cost of lost time
Markets are useful tools for institutions and for the small percentage of participants who possess unusual skill, information, discipline, or luck. For many individuals, however, the market can become a destructive storm when they participate without a tested income structure.
Your Street Wealth describes The Wall Street Cycle as recurring 10%–20% swings roughly every 18 months, along with major retractions that may average about 40% every five to seven years over a lifetime.
The exact timing cannot be predicted. The exposure is undeniable.
A major retraction can cost a minimum of 3.3 or more years of forward progress, depending on the portfolio, age, contributions, withdrawals, and recovery path.
The issue is not whether markets rise. Markets rise when stimulated by earnings, liquidity, innovation, demand, and other forces: not merely because a long-term average says they should.
The issue is whether your retirement can continue progressing when markets do not cooperate.
The 5x Accumulated Loss Truth
Here is a scenario worth testing:
You contribute $100,000 over time. Through repeated drawdowns, missed recovery, fees, taxes, and interrupted compounding, the cumulative opportunity lost may reach $500,000: five times the original contribution.
That is the 5x Accumulated Loss Truth.
It is not a universal forecast or a claim that every investor will experience the same result. It is a warning about scale. People can unknowingly lose six or seven digits over a lifetime because they do not know the value of what they are losing.
Measure the loss. Measure the years. Measure the income that never gets created.
Stop using an old financial architecture
Banks, stocks, and real estate can each serve useful purposes. But as single-pillar assets, they may solve only one part of a retirement problem: and they may carry substantial risk, cost, or limitations.
Think about the consolidation of technology.
Phones, pagers, cameras, calendars, televisions, and computers were once separate tools. A smartphone consolidated many functions into one coordinated device.
Traditional retirement planning can resemble a Rolodex in a SpaceX world: durable in its era, but inadequate for the speed, risk, and technical demands of modern retirement.
Fully Performing Assets™ are designed as multi-pillar assets. Depending on the contract and strategy, they may coordinate five to fifteen functions, such as:
Growth
Protection
Income
Liquidity
Long-term-care support
Tax efficiency
Legacy
This is where concepts such as Uncapped Gains (UCG) and Expanded Market Participation (EMP) may become relevant. EMP can act as a 110%–200% multiplier on UCG: for example, a 10% UCG could produce an 11%–20% credited gain, subject to the specific product, contract, and terms.
Do not accept a broker’s claim that every index strategy is limited to a “3% cap” without examining the actual crediting method, participation rate, spread, cap, floor, fees, and guarantees.
Inspect the contract. Test the model.
Use the 7 Disciplines as your first principles
The 7 Disciplines of Retirement Wealth™ provide the “why” behind a reliable retirement structure:
Protect the Principal: Never spend the engine.
Protect Against Unnecessary Loss: Never risk what you cannot afford to lose.
Protect Forward Progress: Never accept unnecessary step-backs.
Protect Time: Money can recover. Time never does.
Increase Efficiency, Not Risk: Engineer better outcomes.
Upgrade Your Thinking: Accumulation is not retirement income design.
Preserve Every Victory: Turn today’s gains into tomorrow’s guarantees.
This is stewardship. Manage what you have been given. Keep learning. Unlearn assumptions that no longer serve your goals. Seek wisdom before consequences force the lesson.
The guiding questions are direct:
Is your retirement plan designed to preserve your wealth engine?
How much of your retirement should be insulated from unnecessary loss?
How many years could your strategy lose during the next major downturn?
How much future income is lost when time is lost?
Apply the 9 Levels of Retirement Discovery
A serious review should move beyond “What did my account earn?”
Use the nine levels to test the entire architecture:
Outcome: What income and legacy do you actually need?
Cost: What are taxes, fees, inflation, volatility, and lost time costing?
Opportunity: Which assets could become Fully Performing Assets?
Barrier: Which outdated beliefs are limiting your decisions?
Truth: What is your actual return: not the average return?
Risk: Which losses could permanently damage your margin?
Principle: Is principal protected before income is spent?
Value: What is the present value and lifetime usefulness of your wealth?
Synergy: Do your assets, income, taxes, protection, and legacy plan work together?
Then use the FPA Pillars: Income, Protection, Growth, Liquidity, and Legacy: to determine what every dollar is supposed to accomplish.
Identify your retirement personality
Your behavior under uncertainty matters.
Orange : Tyranny of Urgent: Actively trades, reacts to headlines, and pays for motion.
Red : More Risk Is Better: Leaves everything alone and ignores drawdowns and sequence risk.
Yellow : Afraid of Mistakes: Takes profits too early and weakens compounding.
Green : Continuous Learning: Becomes allocation-aware and engineers the outcome.
Choose Green behavior. Learn continuously. Replace participation with rules-based planning.
The Your Street standard is testable: Preserve, Protect & Prolong without avoidable leaks, drains, or losses.
Use OOM™: Odds, Opinions, and Models: to stress-test every assumption. A plan must be testable to be valid. A plan that cannot be tested is merely a promise.
Make the average question more precise
The Three Streets ask different questions:
Wall Street: How is the market performing?
Main Street: How is the economy affecting me?
Your Street: What does this mean for my retirement?
Your Street is where the result becomes personal.
The five-street comparison should test each financial choice against growth, protection, income, liquidity, and legacy: not just today’s account value.
That is the purpose of a Margin Audit™, including a Volatility Recovery Analysis, Compounding Efficiency review, and Sequence of Return Margin test.
The Million Dollar Hour™ Forecast is designed to show how time, losses, leaks, and withdrawals may affect your plan and where greater certainty may be engineered.
For an average-sized qualifying account, the analysis is positioned to identify at least $20,000 in immediate value: a potential 20:1 benefit-to-cost ratio: along with permanent tuition for the Retirement Reliability Academy.
Some Money, Same Time. Different Rules. On Your Street. Different Outcomes.
Peace is the path, wisdom is the way.
Ready for clarity instead of confusion?
The Million Dollar Hour™ is your educational, one-on-one retirement review that reveals where your plan leads : not just where it’s been.
👉 Schedule your session today.