Wall St 2D vs Your St 7D Retirement Plan
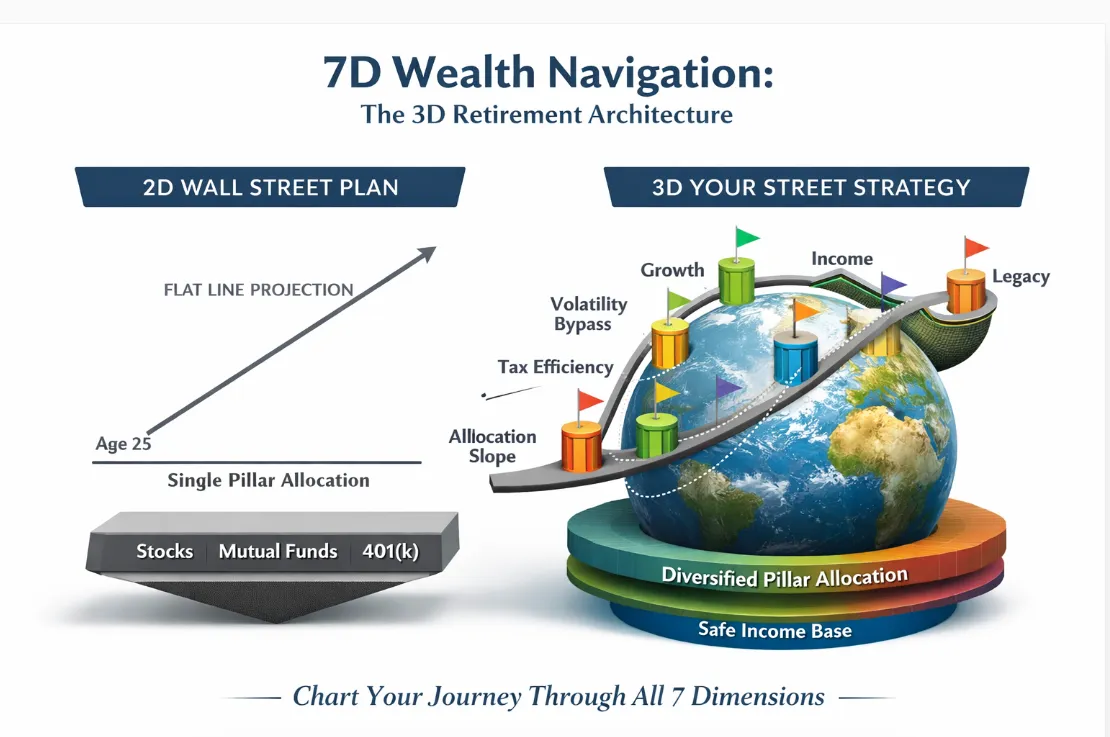
Wall Street (2D) vs Your Street (7D): Why Every Investor Should Care
![[HERO] Wall Street (2D) vs Your Street (7D): Why Every Investor Should Care](https://cdn.marblism.com/jgyl4SkMQOS.webp "[HERO] Wall Street (2D) vs Your Street (7D): Why Every Investor Should Care")
For decades, the financial industry has done a masterful job of convincing you that investing is a two-dimensional game. If you’ve ever sat across from a broker, you’ve seen the flat map they use to navigate your entire future. It usually boils down to two simple questions:
What can I earn? (Return)
What can I lose? (Risk)
This is the traditional Wall Street model. It’s binary. It’s flat. And quite frankly, it’s like trying to navigate a SpaceX flight using a paper map from 1984. While "Risk vs. Return" is a decent starting point for a teenager opening their first savings account, it is a dangerously incomplete framework for someone approaching or living in retirement.
The truth is, wealth does not live in 2D. Your financial life exists in a much larger, more complex reality. At Your Street Wealth, we believe navigating retirement requires a shift from "Participation" in market noise to "Engineered Performance."
Here is why you need to stop thinking in 2D and start looking at the 7D wealth navigation system.
The Problem With Wall Street’s 2D Model: The Time Thief
Wall Street reduces your life to a simple graph. They want you to focus on the "Average Rate of Return." But "average" is a mathematical ghost that doesn't pay for groceries.
The biggest flaw in the 2D model is that it completely ignores Lost Time.
When you are in the "Accumulation Phase" (your 20s and 30s), a market dip is just a sale. But when you are in the "Distribution Phase" (retirement), a 10% or 20% loss doesn’t just reduce your account balance: it bends time.
The Math of Recovery
This is where we have to "unlearn" Wall Street myths. Most investors think if they lose 20%, they just need a 20% gain to be back to even. That is a lie.
A 20% loss requires a 25% gain just to break even.
A 30% loss requires a 42% gain to break even.
A 50% loss requires a 100% gain just to get back to the starting line.
")
While your money is in "recovery mode," it isn't compounding. It’s treading water. You’ve lost the most precious asset you have: Time. This "Volatility Recovery Analysis" reveals a silent drag on your wealth that Wall Street’s 2D charts conveniently hide. This is why many "Quiet Builders": those of you who have worked hard and played by the rules: feel financially fatigued. You’re watching the market go up and down, but your actual progress feels stalled.
Why Your Street Uses a 7D Wealth Model
At Your Street Wealth, we don’t just look at a chart; we look at a navigational system. We treat your wealth like an engineering project. If you were building a bridge, you wouldn't just ask about the "average weight" it could hold; you’d look at structural integrity, wind resistance, and material fatigue.
Your financial future is not a flat line; it is a set of seven directional vectors.
The 7 Dimensions of Wealth Navigation
Growth (Efficiency): How efficiently is your wealth expanding? We look for "Uncapped Gains" (UCG) without the baggage of market downside.
Protection (Principal Defense): Can you look your spouse in the eye and say, "We will never have less money than we have today"? This is about engineered certainty.
Time (Compounding Efficiency): Every year spent recovering from a loss is a year of compounding stolen from your future. We protect the timeline.
ALLOCATION in # of Pillars: Allocation is the number of pillars in the composition of assets, and that count determines the structural integrity of your wealth architecture. A single-pillar asset may look familiar, but familiarity is not strength. The more intelligently your wealth is built across multiple pillars, the more stable, useful, and resilient the design becomes.
Income (Dependable Cash Flow): Is your income "designed" or "dependent"? Wall Street makes your income dependent on market moods. We design it to be guaranteed.
Legacy (Future Generations): What remains for your kids or your cause? This is about controlling the handoff, not just the holding.
Reality Axis (The Truth): This is the anchor. It factors in inflation-adjusted purchasing power, tax impacts, and lifetime sustainability.
Visual Framework: The 7-Vector Wealth Navigation System™

(Insert: Your Street’s 7-Vector Wealth Navigation System™ image)

This visual helps you understand why retirement planning is never just about the "rate of return." If you have 10% growth but 0% protection and 0% liquidity, your "navigation" is broken. You are moving fast, but you might be heading toward a cliff.
Moving from "Participation" to "Engineered Performance"
Most retirement plans are built on Participation. You give your money to a big firm, they throw it into the "Single Pillar" of the stock market, and you hope for the best. It’s a "Rolodex in a SpaceX world." It was a fine strategy in the 1980s, but today’s market moves at the speed of light, and the risks are higher.
At Your Street, we focus on Engineered Performance.
We utilize Fully Performing Assets (FPA). Think of an FPA as the "smartphone" of finance. Remember when you had a pager, a camera, a phone, and a map? Now they are all in one device. An FPA does the same thing for your money. It combines 5 to 15 "pillars" of value: growth, protection, tax-free income, and legacy: into one vehicle.
By using FPAs, we can offer Expanded Market Participation (EMP). Imagine getting a 110% to 200% multiplier on the market’s growth with a hard floor of 0% on the downside. That’s not a dream; it’s engineering.

Why Every Investor Should Care
Retirement failure rarely happens because people didn't save enough. It happens because they were using an incomplete model.
Navigating a 3D world with a 2D map creates:
Unnecessary Volatility: You’re on a roller coaster you never signed up for.
Income Shortfalls: You’re guessing how much you can withdraw based on "averages."
Tax Inefficiency: You’re leaving a massive tip for Uncle Sam because your assets aren't coordinated.
Lost Recovery Years: You’re spending your 60s trying to get back what you lost in your 50s.
When you shift to the 7D model, you stop asking, "What rate of return am I getting?" and you start asking, "What direction is my future moving?"
That is a far more powerful question. It’s the difference between being a passenger on someone else's ship and being the navigator of your own.
The Bottom Line: Your Money, Your Rules
Wall Street is obsessed with activity: buying, selling, and chasing the next "big thing." This hidden complexity is designed to keep you addicted to their research and their fees.
Your Street is obsessed with outcomes.
The 7D Wealth Model isn't just about numbers on a screen; it’s about Sequence of Return Margin. It’s about ensuring that a market crash in year one of your retirement doesn't blow up the next thirty years. It’s about "Compounding Efficiency."
If you are a "Quiet Builder": someone who has been successful but feels uneasy about the "False Model" being sold on TV: it’s time to upgrade your map.

Peace is the path, and wisdom is the way. You can’t predict the future value of a volatile portfolio, but you can engineer a certain path. You can estimate your needs, or you can audit your margins.
The choice is between flat performance reporting and true financial navigation.
Your Money. Your Rules. In Your Time. On Your Street.
Ready for clarity instead of confusion?
The Million Dollar Hour™ is your educational, one-on-one retirement review that reveals where your plan leads : not just where it’s been.
👉 Schedule your session today.