
What to Do After a 40% Market Drop
The 40% Question: What to Do Ten Years Before and Ten Years After a Major Retraction

The Retraction You Haven’t Experienced Yet Is Still in Your Plan
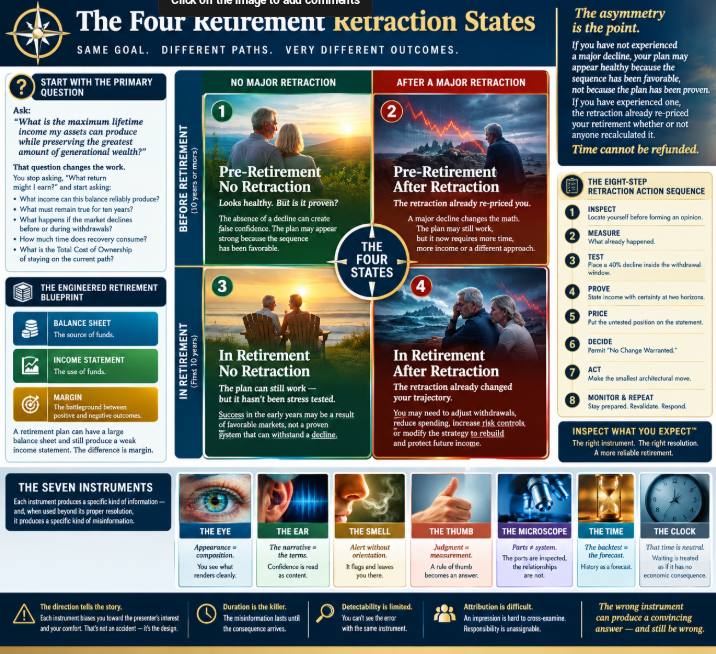
A major market retraction does not affect every retirement plan the same way.
Your position matters.
Are you ten years from retirement? Are withdrawals already underway? Have you already experienced a major decline, or has your plan only been tested by favorable conditions?
Those are four different engineering problems, not four versions of the same problem.
This article gives you the action sequence: Inspect. Measure. Test. Prove. Price. Decide. Act. Monitor.
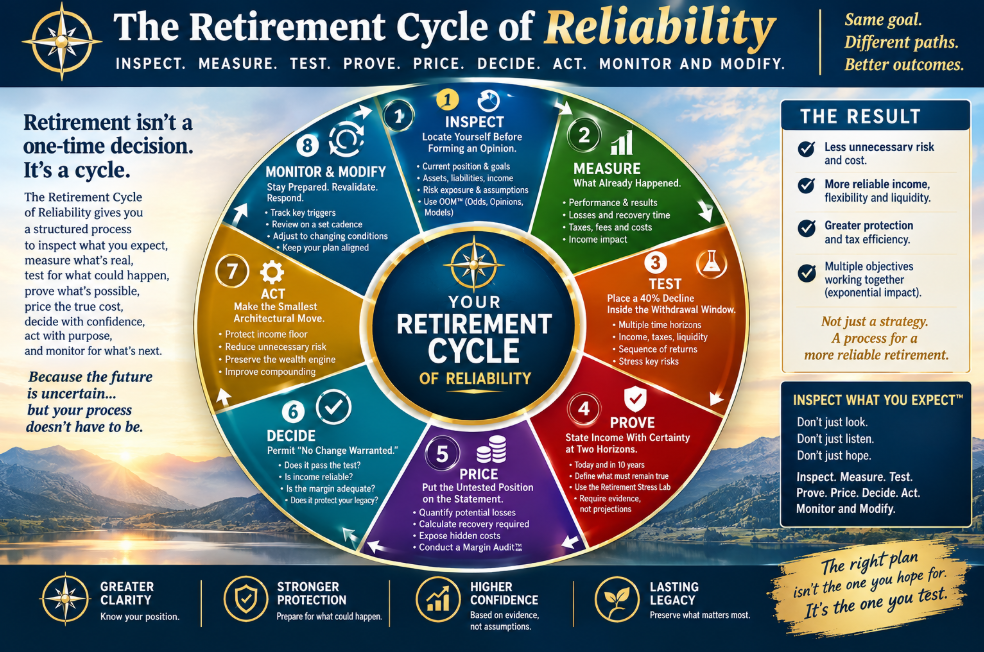
Do not test the promise. Test the behavior.
For context, continue with The Surgeon’s Retirement Plan: A Retirement Risk Evaluation.
The Four Retirement Retraction States
The asymmetry is the point.
If you have not experienced a major decline, your plan may appear healthy because the sequence has been favorable, not because the plan has been proven.
If you have experienced one, the retraction already re-priced your retirement whether or not anyone recalculated it.
Time cannot be refunded.

Start With the Primary Question
Ask:
> What is the maximum lifetime income my assets can produce while preserving the greatest amount of generational wealth?
That question changes the work.
You stop asking, “What return might I earn?”
You start asking:
What income can this balance reliably produce?
What must remain true for ten years?
What happens if the market declines before or during withdrawals?
How much time does recovery consume?
What is the Total Cost of Ownership of staying on the current path?
This is the Engineered Retirement Blueprint:
Balance Sheet: the source of funds.
Income Statement: the use of funds.
Margin: the battleground between positive and negative outcomes.
A retirement plan can have a large balance sheet and still produce a weak income statement. The difference is margin.
The Eight-Step Retraction Action Sequence
Step 1, Inspect: Locate Yourself Before Forming an Opinion
Position first. Opinion later.
Identify your quadrant:
Ten years before retirement with no major retraction.
Ten years before retirement after a major retraction.
Inside the first ten years of retirement with no major retraction.
Inside the first ten years after a major retraction.
Then inspect the actual structure:
Current balance.
Contributions or withdrawals.
Asset allocation.
Guaranteed income.
Required income.
Taxes and fees.
Liquidity.
Beneficiary and legacy objectives.
Exposure to market volatility.
Inspect what you expect.
Use OOM™ (Odds, Opinions, Models) to separate what you know from what you merely assume.
Step 2: Measure What Already Happened
If a retraction already occurred, do not stop at the dollar loss.
Measure:
Peak account value.
Lowest account value.
Percentage decline.
Contributions made during recovery.
Withdrawals taken during recovery.
Time required to return to the prior balance.
Income that was delayed, reduced, or placed at risk.
A 30% loss requires approximately a 42.9% gain to recover. That is the Math of Recovery.
The account statement may show a loss. It may not show the years that loss consumed.
The retraction you already took re-priced your plan whether or not anyone recalculated it.
Step 3, Test: Place a 40% Decline Inside the Withdrawal Window
Test a 40% decline as a condition, not a forecast.
Run the test in more than one quadrant:
What happens ten years before retirement?
What happens five years before retirement?
What happens in year one of withdrawals?
What happens in year five after withdrawals begin?
Test more than the account value. Test the system:
Income.
Taxes.
Withdrawals.
Recovery time.
Legacy value.
Sequence of Return Margin.
Liquidity.
Required spending reductions.
The purpose is not to predict the next decline. The purpose is to discover whether your architecture remains functional when conditions change.
Average frequency is not a prediction.
Step 4, Prove: State Income With Certainty at Two Horizons
Prove two numbers:
Income capacity today.
Income capacity ten years from now.
Then name what must remain true between those two dates.
For example:
No major reduction in withdrawals.
No forced sale during a decline.
No unplanned tax event.
No reliance on an average return that has not been tested.
No depletion of the principal that produces future income.
Use the Retirement Stress Lab to test the dimensions that matter: market loss, inflation, taxes, fees, longevity, liquidity, health costs, and income design.
A projection is not proof. A reliable result must be repeatable, reusable, and supported by evidence.
Step 5, Price: Put the Untested Position on the Statement
Unmeasured costs do not send a warning. They send an arrival.
Price the exposure:
Dollar loss.
Recovery gain required.
Years of delayed compounding.
Income lost during recovery.
Additional taxes created by withdrawals.
Fees paid while the account remains exposed.
Legacy value surrendered.
Include delay as a line item, not empty space.
This is the Margin Audit™. It exposes the Six Wealth Killers:
Taxes.
Fees.
Market volatility.
Inflation.
Complexity.
Poor income design.
A fee that does not remove a wealth killer is a toll with no bridge.
Step 6, Decide: Permit “No Change Warranted”
A real test must be allowed to return no change warranted.
Do not make a product decision before making an architectural decision.
Ask:
Did the current strategy pass the test?
Is the income reliable under the tested conditions?
Is the margin adequate?
Are the risks necessary?
Does the plan preserve principal and time?
Does the strategy protect the intended legacy?
Use the process:
Question → Test → Prove → Decide → Act.
Apply RID: Require, Insist, Demand, to the evidence. Require clarity. Insist on measurable behavior. Demand to know what happens if expectations fail.
Step 7, Act: Make the Smallest Architectural Move
If the evidence supports change, remove the exposure with the smallest effective architectural move.
Do not begin with the largest product.
Begin with what the move must accomplish:
Protect a required income floor.
Reduce unnecessary loss.
Preserve the wealth engine.
Improve Compounding Efficiency.
Protect the Sequence of Return Margin.
Create liquidity without forced selling.
Preserve future income and legacy value.
Then evaluate implementation.
This is the difference between Participation vs. Engineered Performance. Participation accepts the market’s behavior. Engineering designs around the consequences.
The Your Street standard is simple:
Preserve. Protect. Prolong, without leaks, drains, or unnecessary losses.
Step 8: Monitor and Repeat
Do not make one decision and disappear for ten years.
Define the evidence that triggers a new test:
A change in spending.
A new withdrawal.
A major tax-law change.
A 10% or 20% market decline.
A change in health or longevity expectations.
A change in guaranteed income.
A material change in fees.
A change in beneficiary or legacy goals.
Set the cadence before the next problem arrives.
A reasonable rhythm may be annual, with an additional review when a defined trigger occurs. The exact cadence matters less than having one.
Don’t wait. Don’t delay. Don’t hurry. Inspect, test, and act on evidence.

What Does “Once Every Six Years” Actually Mean?
If we accept the planning premise that a 40%+ drawdown has occurred approximately once every six years on a defined historical basis, two mathematical descriptions are possible.
Simple annual-frequency calculation
[
\frac{1}{6}=16.7%
]
That means one event per six years corresponds to an average annual frequency of approximately 16.7%.
Constant-hazard calculation
If the rate is treated as constant:
[
1-e^{-1/6}=15.4%
]
That produces an estimated 15.4% chance of at least one event in a particular year under that model.
Neither figure predicts next year.
Once every six years is a rate, not a schedule.
The constant-hazard version is useful for planning because it allows the event to arrive in year one. A retirement strategy must be tested against an early decline, not built on the hope that the next one politely waits six years.
Historical results also depend on the measurement basis: price return or total return, peak-to-trough or calendar year, which index is used, and whether closely spaced declines are counted separately.
Therefore, state the claim carefully:
> If 40%+ drawdowns have occurred approximately once every six years on a total-return, peak-to-trough basis, that average still does not forecast the timing of the next event.
Any market bands shown in a Your Street Wealth dashboard should be treated as the firm’s own dashboard data, not as a universal forecast.
Anchor the Decision in the Seven Disciplines
This process primarily serves:
Discipline 2, Protect Against Unnecessary Loss: Never risk what you cannot afford to lose.
Discipline 3, Protect Forward Progress: Never accept unnecessary step-backs.
Discipline 4, Protect Time: Money can recover. Time never does.
Discipline 5, Increase Efficiency, Not Risk: Engineer better outcomes.
Discipline 7, Preserve Every Victory: Turn today’s gains into tomorrow’s guarantees.
Use the 9 Levels of Retirement Discovery to go deeper:
Outcome: What income and legacy are required?
Cost: What are volatility, taxes, fees, and delay costing?
Opportunity: What income guarantees are missing?
Barrier: Which assumptions prevent better decisions?
Truth: What is the actual return, not the average?
Risk: What can permanently destroy margin?
Principle: Is principal protected?
Value: What is the lifetime usefulness of each dollar?
Synergy: Do all parts of the plan work together?
Then evaluate whether the assets are single-pillar tools or multi-pillar Fully Performing Assets™ that may coordinate growth, protection, income, liquidity, tax efficiency, long-term care, and legacy.
Your Money. Your Rules. In Your Time. On Your Street.
The Final Test
Do not ask whether your retirement plan has survived so far.
Ask whether it has been tested.
Inspect your quadrant.
Measure the time already consumed.
Test the decline where it would hurt.
Prove income at both horizons.
Price the hidden costs.
Decide without assuming change is mandatory.
Act on the smallest architectural move.
Monitor before the next retraction forces the decision.
That is stewardship.
Continuous learning is not an optional upgrade for a Quiet Builder. Unlearn the average-return story when the evidence does not support it. Learn what your assets actually do. Test behavior before trusting promises.
Peace is the path, wisdom is the way.
Ready for clarity instead of confusion?
The Million Dollar Hour™ is your educational, one-on-one retirement review that reveals where your plan leads, not just where it’s been.
👉 Schedule your session today.