
Retirement Strategies That Maximize Income, Eliminate Risk, and Help Ensure You Never Run Out of Money How to Achieve The Retirement Future Everyone Seeks
Most retirement plans are built on assumptions that no longer hold up—market averages, predictable tax rates, and the belief that time will always recover losses. But as you approach or enter retirement, the rules change. What worked during your accumulation years can become a liability during the withdrawal phase.
This blog is designed to help you rethink traditional strategies and discover a more engineered approach to retirement income—one focused on certainty, efficiency, and control.
Here, you’ll learn how to reduce or eliminate the biggest threats to your financial future, including market losses, rising taxes, hidden fees, and the silent erosion caused by lost time. We break down complex financial concepts into clear, actionable insights so you can make better decisions about your 401(k), IRA, and retirement income strategy.
You’ll also discover why many conventional approaches—like relying on average returns or the 4% rule—can expose you to unnecessary risk, especially when withdrawals begin. Instead, we explore strategies designed to protect your principal, improve compounding efficiency, and create predictable income streams that last.
Our focus is on helping you transition from “assets at risk” to a more stable and structured approach using fully performing assets—where growth, income, and protection work together instead of against each other.
Whether you’re still working or already retired, the goal is simple:
help you keep more of what you earn, generate more reliable income, and build a plan that doesn’t depend on hope, timing, or market luck.
If you’ve ever wondered:
* How to create tax-efficient retirement income
* How to avoid sequence of returns risk
* How to reduce fees and increase net returns
* How to design income that doesn’t run out
—you’re in the right place.
Explore the articles below and start building a retirement strategy based on engineering, not guesswork.
Retirement Income Calculator Truth About Generic Math
Do You Really Need a Retirement Income Calculator? Here’s the Truth About Generic Math
One of the fastest ways to uncover hidden risk is to take our 7 Question Retirement Stress Test.

Start here: See what your retirement actually looks like → 👉 Book Your Million Dollar Hour™
Here’s the Truth About Generic Math
You’ve seen the chart. It’s smooth, it’s green, and it marches upward at a perfect 45-degree angle. You plug in your current savings, your "expected return," and, presto!, the internet tells you you’re going to be a multi-millionaire by age 67.
It feels good. It feels certain. It feels like... a lie.
And that’s the first problem with generic calculators: they sell simplicity where precision is required. They estimate. They round. They smooth over the very risks that can wreck a retirement timeline. Our Million Dollar Hour™ Forecast does the opposite. It pressure-tests your actual strategy, measures your real compounded results, and shows you where market loss, fees, and time decay have been stealing ground.
For the "Quiet Builders": the engineers who live by tolerances, the business owners who survive on margins, and the executives who manage by KPIs: this generic math should trigger every internal alarm bell you have. Because in the real world, wealth doesn't move in straight lines.
The people who dare not to follow the masses are usually looking for something simple: rules that benefit them. Not rules that benefit the offerors. Wall Street tells the masses to follow a system built for Wall Street. On Your Street, we engineer rules that protect your time, protect your wealth, and protect your margin.
If you are planning your life based on a 2D math problem, you aren't building a retirement; you’re participating in a gamble. At Your Street Wealth, we call this "The False Model."
It’s time to unlearn the myths and audit the margin.

2D in a 3D world
The 2D Math Trap: Average vs. Actual
The biggest flaw in every generic retirement income calculator is the "Average Annual Return" myth. It’s 2D math applied to a 3D world.
This is where the graph shape matters. A flat 45-degree slant looks clean, calm, and predictable. But it represents something far less powerful than true compounding: linear growth and lost time. It suggests your money just climbs at the same pace forever, as if markets never interrupt the process and setbacks never steal years from your timeline.
True compounding does not look like a straight slant. It looks more like a hockey stick or J-shaped curve. Early on, growth can seem slow. Then the curve bends upward because you are no longer earning interest only on principal. You are earning interest on interest. That is where acceleration happens. That is where wealth starts behaving like wealth.
Generic calculators flatten that J-curve into a neat diagonal line. That is the lie. They smooth volatility, ignore recovery drag, and pretend every year contributes equally to growth. But when Wall Street volatility knocks your balance backward, the curve does not just dip. It loses momentum. It loses compounding efficiency. It loses time.
Imagine two investors.
Investor A earns a steady 7% every single year for 20 years.
Investor B averages 7% over 20 years, but experiences the actual volatility of the S&P 500: years of +20% followed by -15%.
On a standard calculator, they look identical. In reality, Investor B often ends up with hundreds of thousands of dollars less. Why? Because average returns do not pay your bills. Actual compounded growth does.
And that difference is really a graph problem. Investor A stays closer to the J-curve. Investor B keeps getting shoved back toward the flat slant because losses interrupt the compounding engine. Every reset costs more than money. It costs future acceleration.
Wall Street uses "averages" to hide the truth. They want you to stay focused on the macro headlines while they extract your micro margins through fees and market resets. When you see a smooth line on a screen, you are looking at "Participation" language. It’s designed to keep you in the game, chasing the "FREE Cheese" while ignoring the trap.
The Myth of the Average
This is where Wall Street's "ups and downs" graph becomes a sales tool for false math. They show a jagged line, point to the long-term average, and act like the average tells the whole story. It doesn’t.
An average can look fine on paper. A brochure can say 7%, 8%, even 10% over time. But averages do not compound. Actual dollars compound. And actual dollars get damaged when a down year forces your money to recover before it can grow again.
That is the trap. The jagged graph is the enemy of the J-shaped compounding curve. Every drop interrupts momentum. Every recovery period delays acceleration. Every setback pushes your money farther away from the bend in the curve where interest-on-interest starts doing the heavy lifting.
This is why "false math" sounds smart but fails in real life. A Wall Street average can make a volatile path look acceptable, while the actual math of recovery quietly destroys the compounding curve underneath it. The result is not just lower account values. The result is years of retirement stolen because your money spent too much time healing and not enough time compounding.
Protect the curve. Audit the average. Refuse the false model.
The Math of Recovery: Why a 30% Loss Requires a 42% Gain
If you lose 30% of your portfolio in a market downturn, a 30% gain doesn't bring you back to even. It only brings you back to 91% of where you started.
To actually recover from a 30% drop, you need a 42.8% gain just to get back to zero. This is the Math of Recovery, and it is the silent killer of retirement dreams.
, NPA (Non-Performing Assets), UPA (Under-Performing Assets), and FPA (Fully Performing Assets).")
Generic calculators ignore this asymmetry. They treat a -10% year and a +10% year as a net zero. In the world of Compounding Efficiency, that's a mathematical failure. That is masses math: generic assumptions for generic people, built to keep you following rules that reward the offerors more than the owner of the money.
This is also why the 45-degree slant is such a dangerous visual. It hides the fact that a loss does not just reduce your balance. It delays your return to the J-curve. It pushes back the moment when interest-on-interest can accelerate again. In other words, volatility creates lost time, and generic retirement calculators rarely measure that loss with any honesty.
Every time the market "resets the clock" on your growth, you lose something more valuable than money: Time. Money can recover. Time never does. That is the ultimate loss on Wall Street. On Your Street, our rules are built to protect time so it is not lost in the first place. This is why our Million Dollar Hour™ Forecast focuses on eliminating the need for recovery math entirely by engineering a 0% floor and a personalized path that protects forward momentum.
The Sequence of Return Margin: Your Retirement’s Glitch
If you are 10 years away from retirement, the order in which you receive your returns is almost as important as the returns themselves. This is called Sequence of Return Risk, and generic calculators are fundamentally incapable of modeling it for your specific life.
If the market drops 20% the year you retire, and you start taking withdrawals, you are "cannibalizing" your principal at the worst possible time. You are selling assets while they are on sale.
Most "advice" tells you to simply "wait for the market to come back." But if you’re retired, you don't have the luxury of waiting. You need income today. This is the difference between a Designed Income and a Dependent Income.
Are you controlling your outcomes, or are you depending on a market that operates on a "Greed/Fear" meter?
The Consolidation of Technology: Is Your Plan a Pager or a Smartphone?
Think back to the 1990s. You had a pager for messages, a Walkman for music, a camera for photos, and a physical map for directions. These were "Single-Pillar" tools. They did one thing, and if one broke, the whole system was compromised.
Today, you have a smartphone. It’s a consolidated, multi-pillar device that handles everything with institutional-grade precision.
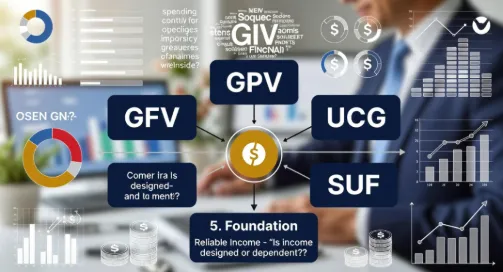
, GFV (Guaranteed Future Value), UCG (Uncapped Growth), and SUF (Safe Under Foot gains).")
Traditional Wall Street planning is the "Pager" of finance. You have a bank account for liquidity, stocks for growth, and insurance for protection. They don't talk to each other. They are single-use products that create hidden complexity and high fees.
We specialize in Fully Performing Assets (FPA). Think of FPA as the "smartphone" of your balance sheet. One vehicle that provides 5–15 "pillars" of value:
Uncapped Gains (UCG) to capture the upside.
Expanded Market Participation (EMP): often a 110% to 200% multiplier on those gains.
Contractual Guarantees instead of market probabilities.
Tax-free access and long-term care benefits.
A generic calculator can’t model a multi-pillar asset because it’s still trying to figure out how to use the "Pager" of a 60/40 stock-to-bond ratio.
Engineering Certainty: The Margin Audit™
Wealth is built on micro margins, not macro headlines.
That is the core difference between a generic retirement calculator and the precision of the Million Dollar Hour™ Forecast. A calculator gives you masses math based on assumptions. A Forecast gives you personalized rules based on your actual money, your actual timing, and your actual exposure to loss. One asks you to follow the crowd into participation math. The other helps you step off that path and follow rules designed to benefit you. One is participation math. The other is financial architecture.
When we perform a Margin Audit™ during a Million Dollar Hour™ session, we don't look at "averages." We look at your Sequence of Return Margin and your Volatility Recovery Analysis. We look for the "leaks": the fees and taxes that act as friction on your compounding.
Wall Street thrives on uncertainty. They use hidden complexity to keep you addicted to the daily research cycle. They want you to feel like you’re "spinning sharp knives" every time interest rates ripple.
We choose a different path. We call it the Engineering of Certainty.
Audit the margin.
Protect your time.
Engineer certainty.
Instead of a "projection" (which is just a fancy word for a hope), we provide a Forecast rooted in Asset Liability Management (ALM). We contrast the -30% to +30% volatility of Wall Street with the 0% to +30% stability of Your Street.
Peace is the Path, Wisdom is the Way
If you are a Quiet Builder, you’ve spent your life mastering your craft. You didn’t get where you are by guessing. Why start now?
A generic retirement income calculator is a toy. It’s fine for "Participation." But if you want Performance, you need architecture. You need a plan that recognizes that wealth is a designed process that grows and heals, not a false architecture that extracts and harms.
If you refuse to follow the masses, good. That instinct is serving you. Protect your time with rules that benefit you. Refuse rules that only benefit the offerors. On Wall Street, time is routinely lost and then excused as "just part of the market." On Your Street, time is engineered to be protected, because time lost is the ultimate loss.
It’s time to move from "Knowing vs. Hoping." It's time for Your Money, Your Rules, In Your Time, On Your Street.
Ready for clarity instead of confusion?
The Million Dollar Hour™ is your educational, one-on-one retirement review that reveals where your plan leads : not just where it’s been.
👉 Schedule your session today.
Discover Which Wealth Killers Are Affecting You
Most people are impacted by 6–9 and don’t realize it
Wealth Killer #1: The Granddaddy : Why Market Volatility is Your Retirement’s Greatest Enemy
Concerned about market losses, taxes, or income reliability?
Take the 7 Question Retirement Stress Test →
You can keep participating… Or you can finally see the outcome. The Million Dollar Hour™ shows you exactly:
✔ Where you are ✔ Where you’re going ✔ How to fix the gaps 👉 Book your session now