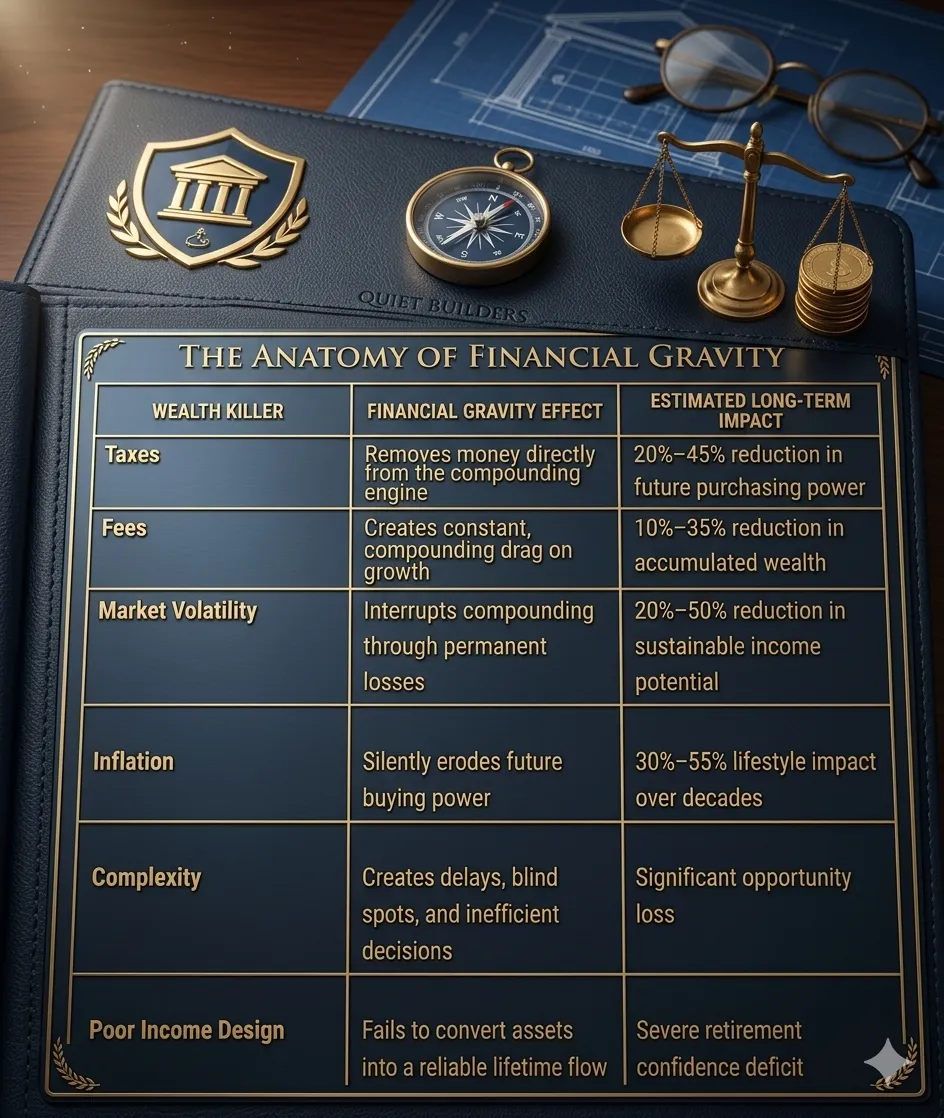
6 Hidden Wealth Killers Draining Retirement
Are You Losing 50% of Your Future Income to These 6 Killers?
Start here: See what your retirement actually looks like → 👉 Book Your Million Dollar Hour™

One of the fastest ways to uncover hidden risk is to take our 7 Question Retirement Stress Test.
There are 6 Financial Gravity Forces, Shrinking about 50% of Future Income.
For decades, successful engineers, business owners, and corporate executives have been sold the same Wall Street script: save hard, stay diversified, and trust that market participation will somehow become retirement certainty.
That is the Shiny Object. The account balance. The average return story. The projection.
The problem is the Dark Object. The hidden losses. The time tax. The leaks. The structural drag that shows up when retirement income planning collides with real life.
As retirement approaches, the uneasiness gets louder. Account values swing with headlines. Fees come out whether you win or lose. Taxes wait at distribution. Inflation keeps moving the finish line. And sequence of returns risk can gut a plan right when income must begin.
In institutional-grade Asset Liability Management, that invisible downward pull has a name: Financial Gravity.
When left unchallenged, Financial Gravity can siphon away 50% or more of your future income potential before you ever use it. That is not bad luck. That is bad architecture. It is also a stewardship failure. Quiet Builders have a duty to protect what they have built, keep learning, and stop confusing participation with engineered performance.
This post serves Discipline 2 — Protect Against Unnecessary Loss and Discipline 5 — Increase Efficiency, Not Risk from The 7 Disciplines of Retirement Wealth™. It also presses the key question: How much of your retirement should be insulated from unnecessary loss?
The central diagnostic for this conversation is the Anatomy of Financial Gravity chart. Use it as a structural analysis tool. Use it as a risk mitigation schematic. Use it to see what Wall Street leaves conveniently blurry.
Structural Analysis: The Real Conflict Is Income, Not Account Value
Most people heading toward retirement focus on the wrong scoreboard. They stare at account balance and ignore income durability.
That is backwards.
The primary question is not, “What is my portfolio worth on paper?” The primary question is: What is the maximum lifetime income your assets can produce while preserving the greatest amount of generational wealth?
That is where the Engineered Retirement Blueprint starts:
Balance Sheet: the source of funds
Income Statement: the use of funds
Margin: the battleground between success and failure
Wall Street sells Participation. Your Street Wealth engineers Performance.
Participation says:
Hope average returns are enough
Accept losses as normal
Pay fees for exposure
Withdraw income from unstable assets
Engineered Performance says:
Audit the margin
Protect retirement savings from market crash exposure
Reduce unnecessary drag
Build guaranteed retirement income and guaranteed lifetime income through design, not hope
That difference matters because of the Wall Street Cycle. Markets commonly swing 10% to 20% about every 18 months, with major retractions around 40% every 5 to 7 years over a lifetime. Each major setback can cost 3.3+ years of compounding time. Money can recover. Time never does.
Now apply The Math of Recovery:
A 10% loss needs an 11% gain to recover
A 20% loss needs a 25% gain
A 30% loss needs a 42% gain
A 40% loss needs a 67% gain
A 50% loss needs a 100% gain
That is why the 7% to 10% “average return” story is often a rouge number. It ignores the total of all negatives. It ignores lost time. It ignores income damage. It ignores the 5x Accumulated Loss Truth, where $100,000 of contributions can lead to vastly larger cumulative losses over a lifetime of repeated drawdowns, fees, and interrupted compounding.
So let’s run the diagnostic.
Risk Mitigation Schematic: The 6 Killers Behind Financial Gravity
1. Taxes: The Distribution Leak

Taxes are not a minor annoyance. They are a structural leak in retirement income planning.
Traditional IRAs and 401(k)s are tax-deferred, not tax-free. That means a large part of what looks like “your money” may actually be a future tax obligation. When distributions begin, taxable income can increase just as retirees need control the most.
Structural impact:
Ordinary income treatment on withdrawals
Potentially higher future tax brackets
Reduced spendable retirement cash flow
Less room for legacy preservation
Risk mitigation principle: Improve efficiency, not risk. Coordinate tax design before income begins.
This is Level 2 — Cost in the 9 Levels of Retirement Discovery™. If you ignore taxes, you are ignoring one of the largest silent leaks in the system.
2. Fees: The Toll With No Bridge
Wall Street often hides cost inside complexity. Advisory fees. Wrap fees. Fund expenses. Administrative layers. Management costs buried under management costs.
A 1.5% to 2% annual drag may sound harmless. It is not. Over time, it can destroy a meaningful share of compounding efficiency because the removed dollars never get a chance to work again.
Structural impact:
Lower net returns in up years
Full fee extraction in down years
Reduced compounding efficiency
No built-in protection against losses
That is the insult. You pay the fee whether the plan works or not. It is a fee for failure. A toll with no bridge.
Risk mitigation principle: Demand engineering value, not just product access.
This is one reason Your Street Wealth emphasizes Participation vs. Engineered Performance. If a fee does not help neutralize wealth killers, it is not helping build retirement. It is just draining it.
3. Market Volatility: The Sequence-of-Returns Trap
This is the killer most investors underestimate.
Volatility during accumulation is painful. Volatility during distribution can be catastrophic. That is sequence of returns risk. If losses show up early in retirement, withdrawals compound the damage by forcing you to sell impaired assets to fund lifestyle needs.
Structural impact:
Permanent impairment of retirement income
Higher withdrawal stress after losses
Compounding reset
3.3+ years of time lost per major retraction
A 30% drop is not just a chart problem. It is an income problem. It is a time problem. It is a stewardship problem.
Risk mitigation principle: Protect forward progress. Never accept unnecessary step-backs.
This directly serves Discipline 3 — Protect Forward Progress and Discipline 4 — Protect Time. It also answers a critical question: How many years could your current strategy lose during the next major downturn?
If your retirement depends on selling volatile assets for income, your plan may not deliver guaranteed retirement income when you need it most.
4. Inflation: The Silent Lifestyle Shrinkage
Inflation does not usually arrive with drama. It arrives with persistence.
Healthcare rises. Food rises. Travel rises. Home maintenance rises. The same lifestyle quietly costs more each year. If your strategy sits in low-performing single-pillar products or excessive cash, the value of your purchasing power erodes in slow motion.
Structural impact:
Reduced lifestyle flexibility
Increased pressure on distributions
Lower real income over time
Greater fear of spending
Risk mitigation principle: Build growth that does not require destructive downside exposure.
This is where many investors get trapped between two bad options:
Take too much Wall Street risk
Take too little growth and lose to inflation
Your Street Wealth approaches this differently through architecture. The objective is not random upside. The objective is efficient growth, protected principal where needed, and stronger income durability.
5. Complexity: The Coordination Failure

Complexity is not sophistication. Often, it is camouflage.
Many retirement plans are a pile of disconnected products. A few market accounts here. A bank product there. Maybe some real estate. Maybe an annuity nobody fully understands. Maybe an old 401(k) still floating around. That is not architecture. That is a junk drawer.
Structural impact:
Overlapping fees and tax exposure
Conflicting strategies
Hard-to-measure risk
Missed opportunity to coordinate assets for income
This is where the Single Pillar vs. Multi-Pillar distinction matters. Traditional banks, stocks, and real estate are often single-pillar tools. Useful in narrow roles, yes. Sufficient as a complete retirement architecture, no.
By contrast, Fully Performing Assets (FPAs) operate more like the smartphone analogy. Just as phones, pagers, cameras, GPS devices, and TVs consolidated into one smartphone, retirement architecture can consolidate multiple functions into one coordinated asset class. FPAs can provide 5 to 15 pillars of value, including growth, protection, tax advantages, long-term care features, and income efficiency, often with low fees and A+ guarantees.
That is modern retirement engineering. Everything else starts to look like a Rolodex in a SpaceX world.
6. Poor Income Design: The Final Failure
This is where all the earlier mistakes cash out.
Many advisors still solve retirement with accumulation logic. Bigger pile. More exposure. Hope the line goes up. But retirement is not mainly an accumulation problem. It is an income design problem.
If there is no rules-based plan for guaranteed lifetime income, then retirement becomes guesswork.
Structural impact:
Uncertain withdrawal sustainability
Overspending or underspending
Constant second-guessing
Increased risk of outliving assets
Risk mitigation principle: Engineer income first. Let assets serve the income mission.
This serves Discipline 6 — Upgrade Your Thinking. Accumulation strategies are not retirement strategies. New results require new principles.
A well-built plan should help answer:
How much income can your assets safely produce?
Which assets should remain liquid?
Which assets should be insulated from unnecessary loss?
How do you create rising confidence instead of rising anxiety?
That is the difference between hoping for income and engineering it.
From Participation to Engineered Performance

Most pre-retirees have been trained to confuse motion with progress. Rebalance. React. Chase. Wait. Recover. Repeat.
That is Participation.
Engineered Performance is different. It starts with diagnosis, not sales. It audits what is helping and what is hurting. It identifies Assets at Risk (AAR), isolates hidden liabilities, and looks for ways to convert weak, fragmented, or exposed assets into stronger architecture.
In practical terms, that means asking:
Which assets are producing true value?
Which assets are leaking value?
Which assets should be repositioned for protection and income?
How do we improve Sequence of Return Margin before retirement begins?
This is where the Anatomy of Financial Gravity chart becomes more than a visual. It becomes a planning instrument. It helps reveal:
The hidden cost of taxes, fees, and inflation
The income damage created by volatility
The coordination failure caused by complexity
The difference between paper growth and usable income
It also aligns with the FPA Pillars conversation. Traditional assets are often single-use. Fully Performing Assets are multi-pillar by design. When relevant, they can combine protected growth, low fees, tax efficiency, long-term care features, and lifetime income support. Add Uncapped Gains (UCG) and Expanded Market Participation (EMP) where appropriate, and the conversation changes from “How much risk should I take?” to “How efficiently can this dollar perform?”
That is what Quiet Builders should demand. Better architecture. Better stewardship. Better outcomes.
Peace is the path, wisdom is the way.
The Diagnostic Next Step: Run the Million Dollar Hour™ Forecast
You cannot out-save flawed design. You cannot out-earn unnecessary loss. And you cannot reliably build retirement income on top of a false model driven by fear and greed.
What you can do is run a real diagnostic.
The Million Dollar Hour™ Forecast is not a free teaser. It is a professional engineering session for serious people who want to understand where their current plan actually leads. In one focused review, Your Street Wealth helps you:
Calculate actual compounded growth versus assumed averages
Expose the Shiny Object and the Dark Object side by side
Measure volatility damage through a Volatility Recovery Analysis
Audit taxes, fees, inflation drag, and compounding inefficiency
Identify lost years caused by the Wall Street Cycle
Compare Participation against an engineered path toward guaranteed retirement income
Clarify how to better protect retirement savings from market crash exposure
Design for income, not just accumulation
This is the work of stewardship. Learn. Unlearn. Audit the margin. Protect your time. Engineer certainty.
If you are a high-intent Quiet Builder, the next move is simple: stop guessing and run the numbers.
Ready for clarity instead of confusion?
The Million Dollar Hour™ is your educational, one-on-one retirement review that reveals where your plan leads — not just where it’s been.
👉 Schedule your session today.

Discover Which Wealth Killers Are Affecting You
Most people are impacted by 6–9 and don’t realize it
Wealth Killer #1: The Granddaddy : Why Market Volatility is Your Retirement’s Greatest Enemy
Concerned about market losses, taxes, or income reliability?
Take the 7 Question Retirement Stress Test →
You can keep participating… Or you can finally see the outcome. The Million Dollar Hour™ shows you exactly:
✔ Where you are ✔ Where you’re going ✔ How to fix the gaps 👉 Book your session now