
The 100 Year Window: Why Your Retirement Chart Might Be Deception
The 100-Year Window: Why Your Retirement Chart Might Be a Wall Street Deception
One of the fastest ways to uncover hidden risk is to take our 7 Question Retirement Stress Test.
![[HERO] The 100-Year Window: Why Your Retirement Chart Might Be a Wall Street Deception](https://cdn.marblism.com/J_zTiqd2mPM.webp "[HERO] The 100-Year Window: Why Your Retirement Chart Might Be a Wall Street Deception")
Start here: See what your retirement actually looks like → 👉 Book Your Million Dollar Hour™
If you walked into a room and someone asked you to look through a window to see the future, you’d expect a clear, panoramic view. But in the world of Wall Street, they don’t give you a window. They give you a keyhole.
Most investors are making life-altering decisions based on a 1- or 2-year chart. These snapshots are designed to do one thing: make performance look favorable so you keep your money in the "participation" game. But retirement isn’t a 24-month sprint. It’s a marathon that spans generations.
At Your Street Wealth, we look at the "Window of Retirement" through a much wider lens. If you aren't looking at a 100-year window for your Sources of Funds and a 65-year window for your Uses of Funds, you aren’t planning: you’re guessing. And in this economy, guessing is a luxury you can’t afford.
The Deception of the Short-Term Chart
Wall Street is notorious for showing you what I call "Recency Bias Architecture." They’ll pull up a chart of the last eighteen months, point to a green line, and tell you you’re doing great.
But anyone can change the scale of a chart to make it look like a win. By narrowing the window, they hide the "lost time": those years where your portfolio took a 30% hit and spent the next half-decade just trying to get back to zero. They focus on participation (being in the market) rather than engineered performance (guaranteed outcomes).
When you look through a 2-year window, you see noise. When you look through a 100-year window, you see the truth. You see that market volatility is a "sharp knife" that can sever your retirement dreams if you aren't careful.
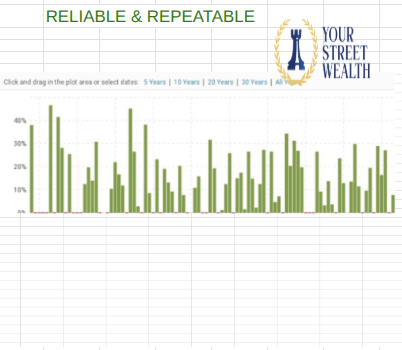
The 100-Year Source vs. The 65-Year Use
To build a plan that actually works, we have to separate where the money comes from and where it goes.
The 100-Year Goal for Sources of Money: Your sources of funds need to be engineered to last a century. Why 100 years? Because your legacy and your spouse’s longevity matter. We look for "Multi-Pillar" assets that provide growth, protection, and tax-advantaged income. These are what we call Fully Performing Assets (FPA).
The 65-Year Goal for Uses of Money: From the moment you start your career to the day the last check is written, you have roughly 65 years of "Uses of Funds." This includes your lifestyle, healthcare, taxes, and the "leaks" that most people ignore.
If your advisor is only showing you a 1-year projection, how can you possibly know if your 65-year use of funds is sustainable? Most people don't understand how to establish a baseline. Without a baseline, you can’t refer back each year to see if your forecast is taking you closer to your goal or further away.
The "Hidden" Progress in Your 401k
The standard 401k plan is essentially a "Rolodex in a SpaceX world." It was a great invention forty years ago, but it’s inadequate for the speed and risk of today's markets.
The biggest problem? Evidence of progress is hidden.
In a traditional 401k or brokerage account, your "progress" is tied to a fluctuating number. If the market goes up 10%, you feel like you’ve made progress. If it drops 10% the next month, that progress vanishes. You are trapped in a cycle of uncertainty.
This lack of a fixed baseline is the primary obstacle to peace. At Your Street Wealth, we believe that Peace is the Path, Wisdom is the Way. Wisdom tells us that we cannot predict future portfolio values when losses and fees are uncontrollable. Peace comes from engineering the outcome so the baseline is fixed, guaranteed, and measurable.

Unlearning the Single-Pillar Myth
Most people are taught to collect "Single-Pillar" assets. A bank account does one thing (stores cash). A stock does one thing (aims for growth). Real estate does one thing (provides equity/rent).
Think of this like the technology of the 1990s. You had a pager, a camera, a calculator, and a phone. They were all separate devices. Today, you have a smartphone that consolidates all of those into one high-performing tool.
In financial architecture, Fully Performing Assets (FPA) are the "smartphone" of finance. An FPA can consolidate 5 to 15 pillars of value: growth, protection, long-term care, and tax-free income: into one vehicle. Instead of chasing "Participation" in a risky market, we use Engineered Performance to ensure that your money is working on multiple levels at once.
The Math of Recovery: Why a 0% is Your Best Friend
Wall Street loves to talk about "Average Returns." But you can’t spend an average; you can only spend actual dollars.
If you have $100,000 and lose 30%, you have $70,000. To get back to $100,000, you don't need a 30% gain: you need a 42.8% gain. This is the Math of Recovery, and it’s the silent killer of retirement dreams.
When you establish a baseline through our engineering process, we eliminate the need for recovery. By utilizing assets with Uncapped Gains (UCG) and 0% Floors, we ensure that your window never shows a downward trend. When the market drops, you stay level. When it rises, you participate in that growth (often with a multiplier like 110% to 200% through Expanded Market Participation).
Establishing Your Baseline: The Million Dollar Hour™
How do you discern if a chart is a deception? You stop looking at their charts and start looking at your own Margin Audit™.
Most "Quiet Builders": those of you who have worked hard, saved well, but feel a lingering sense of unease: don’t need another product. You need a design. You need to know:
What is my Volatility Recovery Analysis?
Where are my Sequence of Return Margins?
Is my plan built on Micro Margins or Macro Headlines?
Establishing this baseline is exactly what we do in the Million Dollar Hour™ Forecast. This isn't a "free consultation" where someone tries to sell you a mutual fund. This is a $995 high-precision engineering session designed for those who are tired of flying blind. Guaranteed to show you how to Increase your account value by $20,000 - $100,000 immediately.
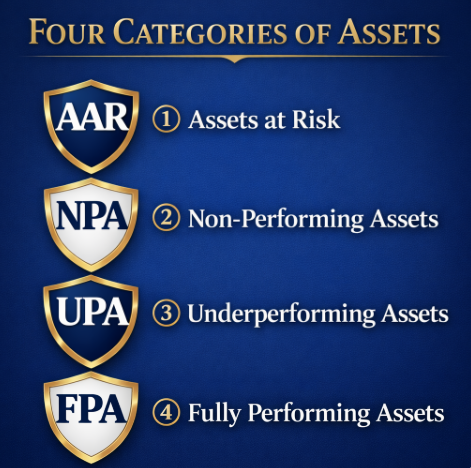
In 60 minutes, we strip away the Wall Street noise and build a foundational review that reveals exactly where your forecast will take you. We look at your Assets at Risk (AAR), Non-Performing Assets (NPA), and Underperforming Assets (UPA) and show you the mathematical path to moving them into Fully Performing Assets (FPA).
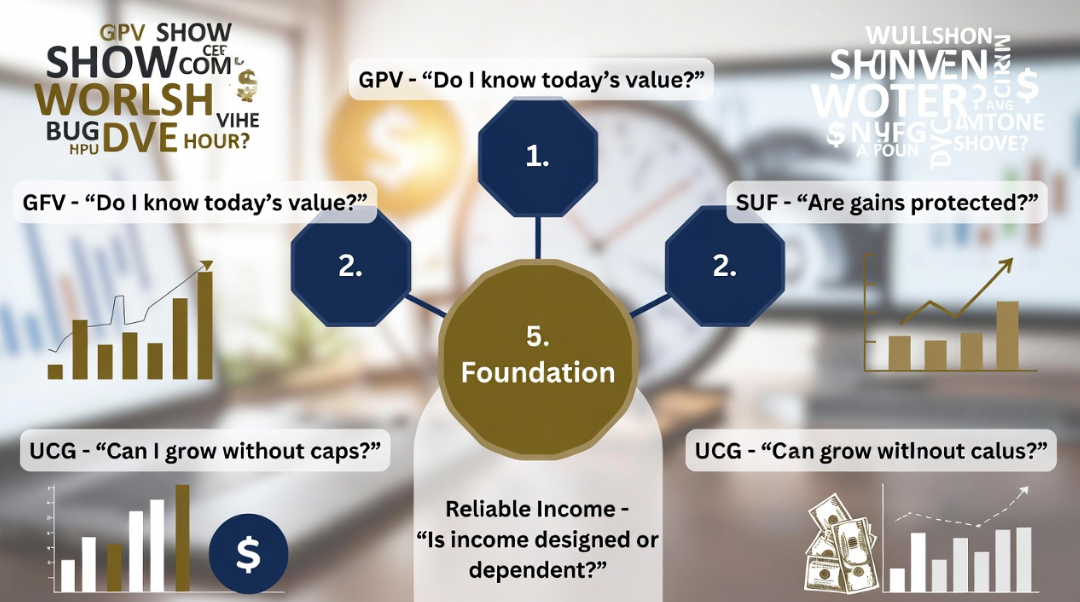
Your Money, Your Rules, On Your Street
The goal of our 100-year window is to move you from a state of "Participation" (gambling on someone else's rules) to "Performance" (executing your own rules).
When you have a baseline, you have clarity. When you have clarity, the fear and greed cycle of Wall Street loses its power over you. You no longer care about the 2-year chart on the evening news because you are focused on your 65-year Uses of Funds and your 100-year Sources of Funds.
Remember: Wisdom is actionable. It’s not just a feeling; it’s a series of decisions backed by institutional-grade banking architecture. If you are ready to stop looking through the keyhole and start looking through the panoramic window of your actual financial future, it’s time to establish your baseline.

Stop letting Wall Street dictate the size of your window. Take control of your architecture. Because at the end of the day, it's your money, your rules, in your time, on your street.
Ready for clarity instead of confusion?
The Million Dollar Hour™ is your educational, one-on-one retirement review that reveals where your plan leads : not just where it’s been.
👉 Schedule your session today.
Discover Which Wealth Killers Are Affecting You
Most people are impacted by 6–9 and don’t realize it
Wealth Killer #1: The Granddaddy : Why Market Volatility is Your Retirement’s Greatest Enemy
Concerned about market losses, taxes, or income reliability?
Take the 7 Question Retirement Stress Test →
You can keep participating… Or you can finally see the outcome. The Million Dollar Hour™ shows you exactly:
✔ Where you are ✔ Where you’re going ✔ How to fix the gaps 👉 Book your session now
Wealth Killer #2: The 4% Rule Myth : Why 'Safe' Withdrawal Rates Are Dangerous