
Top 10 Causes of Market Retractions
The Market Will Retract. Here's What Triggers It.
Start here: See what your retirement actually looks like → 👉 Book Your Million Dollar Hour™

One of the fastest ways to uncover hidden risk is to take our 7 Question Retirement Stress Test.
How Much will It Retract and How Often?
If you’ve spent any time on Wall Street, you’ve been sold the Shiny Object. You know the one: it’s that glowing 7–10% "average annual return" mirage that brokers dangle to keep you "participating" in the market.
But for every Shiny Object, there is a Dark Object lurking in the shadows: the cumulative cycle losses, the wealth killers, the time tax, and the hidden fees that traditional plans conveniently forget to mention.
The truth is, Wall Street operates on a False Model driven by a constant oscillation between fear and greed. While your broker tells you to "stay the course," the Wall Street Cycle is silently grinding away at your most precious asset: your time. We see 10–20% swings every 18 months and major ~40% retractions every 5–7 years.
Each one of those major swings costs you a minimum of 3.3+ years of lost time. In a 30-year retirement, you simply don’t have enough decades to keep resetting the clock.
To protect your retirement, you must unlearn the myth of "participation" and embrace the architecture of "performance." That starts with understanding exactly what pulls the rug out from under the market.
The Top 10 Causes of Market Retractions
Market retractions aren't "accidents"; they are engineered into the very fabric of the Wall Street system. Based on historical data and institutional-grade Asset Liability Management (ALM) principles, here are the ten primary catalysts that turn your Assets at Risk (AAR) into hidden liabilities.
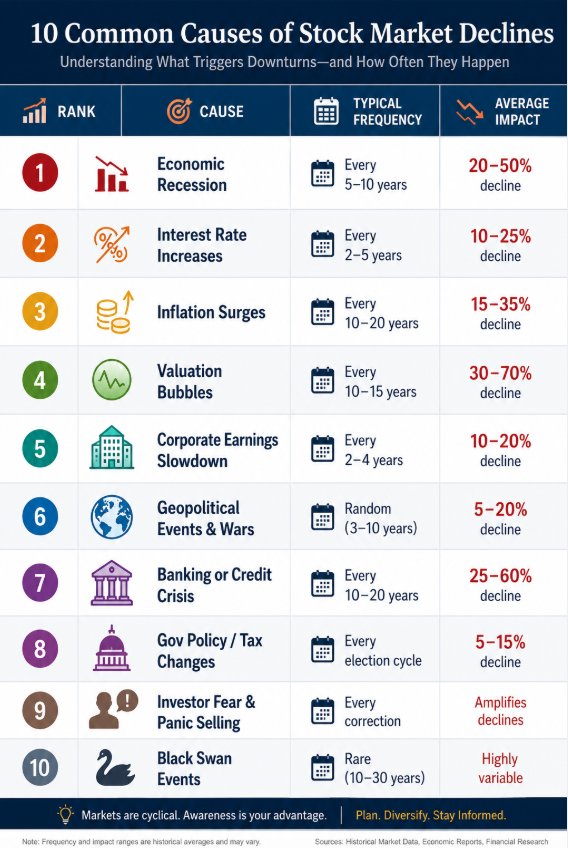
1. Economic Recession
The undisputed heavyweight champion of market killers. When the economy shrinks, consumer spending drops, and the "Shiny Object" loses its luster. A recession doesn't just hit your portfolio; it creates a negative margin where the accumulation of lost money and time becomes a mountain you may never finish climbing.
2. Interest Rate Increases
Think of interest rates as "spinning sharp knives." When rates rise, the ripples move through every sector. This is why we focus on Level Yield Amortization: it’s about healing the balance sheet when the market's tools are working against you.
3. Inflation Surges
Inflation is the silent "Time Tax." It erodes your purchasing power while Wall Street fees (the "toll with no bridge") continue to extract value regardless of whether you are winning or losing. This is one of the 4 hidden retirement killers that experts frequently miss.
4. Valuation Bubbles
Greed drives prices to unsustainable heights (the "Shiny Object" phase). Eventually, the math of recovery catches up. Remember: a 30% loss requires a 42% gain just to get back to zero. While you wait for that 42% gain, your retirement clock is still ticking.

The Common Thread: The Greed/Fear Meter
The cycle is predictable because human psychology is predictable.
Greed drives prices higher and risk accumulates quietly.
A Catalyst (like an interest rate hike or an earnings miss) exposes the weakness.
Fear accelerates the selling.
The Wall Street Cycle resets.
This is why we say "Risk is for Business, Not Retirement." You may have been a "Quiet Builder" who took risks to accumulate your wealth, but the rules change when you move from the "Source of Funds" (Balance Sheet) to the "Use of Funds" (Income Statement).
The 5x Accumulated Loss Truth
Most investors focus on the contribution. They think, "I put in $100k, and the market went down 20%, so I lost $20k."
Wrong.
Through the lens of Compounding Efficiency, we know the 5x Accumulated Loss Truth: $100k contributed can lead to $500k in cumulative losses over a lifetime when you account for the lost growth on the money that is no longer there. You aren't just losing today's dollars; you are losing the future "soldiers" that were supposed to fight for your retirement income.

Architecture vs. Participation
Most retirement plans are like a "Rolodex in a SpaceX world." They were durable in the 1980s, but they are inadequate for the speed and technical demands of modern retirement.
On Wall Street, you are a "Participant." You are gambling on "Average Returns": rouge numbers that fail to account for the total of all negatives. In fact, industry titans admit that only 3% of people are successful on Wall Street through skill and luck.
On Your Street, we use Engineering.
We move your foundation from Assets at Risk (AAR): which are essentially hidden liabilities: to Fully Performing Assets (FPA).
The "Smartphone" of Finance
Think of the consolidation of technology. We used to carry a phone, a pager, a camera, and a map. Now, we have a smartphone.
Traditional assets (Banks, Stocks, Real Estate) are "Single-Pillar" assets. They do one thing, often with high fees and high risk.
An FPA is the "smartphone" of finance. It provides 5–15 pillars of value (growth, protection, LTC, tax-free income) with 0%–1.5% fees and A+ contractual guarantees.
By using an Engineered Retirement Blueprint, you can achieve Uncapped Gains (UCG) with a 0% Floor. When the market drops 30% due to any of the 10 causes above, your floor stays at zero. You keep your time. You keep your wealth.

The Two-Window Reality of Retirement Planning
Retirement planning lives in two windows, not one. The first is the accumulation phase: roughly 40 working years. The second is the distribution phase: another 20–30 years in retirement. Put them together and you get 60–70 total years of market exposure.
Now apply the documented Wall Street Cycle. If retractions of 10–20% show up every 18 months, you are looking at roughly 40–47 compounding-resetting retractions over a lifetime.
This is where most planners fail. They model the accumulation window with fantasy 7–10% straight-line projections, then act like the distribution window is somehow exempt from retractions. It is not. In fact, the distribution phase is the more dangerous window because of sequence-of-returns risk. Losses hurt more when you are taking income out at the same time. Money can recover. Time never does.
Ignore retractions in the first window and you distort the growth story. Ignore them in the second window and you distort the income story. Ignore them in both windows and you are not running a plan. You are running a hope-based scenario.
So ask the hard question: if the Wall Street Cycle is this frequent, and if it touches both windows of the same retirement journey, how can anyone not account for retractions for the entire plan?
The Two-Window Reality Chart: Truth vs. The False Model

> Wall Street's 200-Year Secret
>
> Wall Street claims none of these retractions occur by simply never mentioning them. But does the market decline? If so, by how much and how often?
>
> That is what this chart reveals. The cyclical market retraction occurs every 18 months on average with a 10-20% decline. The Truth and the False Model of Wall St can no longer be ignored after 200 years of deception.
Where Does 7% Come From?
It comes from a clean-looking Wall Street shortcut. The long-term arithmetic average of the S&P 500 is often quoted at roughly 10% nominal, minus about 3% inflation, rounded to 7%. Sounds tidy. Sounds smart. Sounds completely harmless.
It is built on two lies.
Arithmetic vs. Geometric.
The market does not deliver 7% every year like a metronome. It delivers years like +32%, -18%, +12%, -37%, +24%. The arithmetic average is the advertised number. The geometric return is the lived number. And the geometric return is always lower because volatility has a compounding cost. That cost is volatility drag. It eats the gap between the big headline number and the smaller real-world outcome. Wall Street, of course, prefers the bigger number. Shiny sells.Sequence of returns.
Even if the average holds over 100 years, an individual retiree does not get 100 years. They get one specific sequence. And if that sequence opens with a -20% year while income is being pulled out, the whole plan can implode. The average did not lie. The timing just murdered the outcome.
In the land of participation, people are simply hoping the promise of gains will outrun the losses of time, money, and income needs without any serious consideration of the negatives. That is not a plan. That is a prayer dressed up in a pie chart.
The Margin Audit™: Choosing Your Impact
You can estimate your income needs, but you can never predict future portfolio value when losses and leaks (fees/taxes) are uncontrollable.
The Million Dollar Hour Income Analysis Comparison is the diagnostic tool that allows you to shine a light on both the Shiny and Dark objects simultaneously. It allows you to perform a Margin Audit: the battleground between positive and negative outcomes: and choose the retraction impact you design for.
Stop hoping the "Wall Street Cycle" will be kind to you. It won't. The conservative baseline is simpler and harsher: expect 10–20% retractions every 18 months. That documented cycle translates to roughly 20 retractions in a 30-year retirement. And those frequent, smaller retractions are the real threat. They actively choke Time & Compounding. Each one resets the compounding clock, and 20 resets in 30 years leaves no room for recovery. The real question is not whether retractions will happen. The real question is whether your retirement plan can survive them.
Peace is the path, wisdom is the way. It’s time for Some Money, Same Time. Different Rules. On Your Street. Different Outcomes.
Ready for clarity instead of confusion?
The Million Dollar Hour™ is your educational, one-on-one retirement review that reveals where your plan leads : not just where it’s been.
👉 Schedule your session today.

Discover Which Wealth Killers Are Affecting You
Most people are impacted by 6–9 and don’t realize it
Wealth Killer #1: The Granddaddy : Why Market Volatility is Your Retirement’s Greatest Enemy
Concerned about market losses, taxes, or income reliability?
Take the 7 Question Retirement Stress Test →
You can keep participating… Or you can finally see the outcome. The Million Dollar Hour™ shows you exactly:
✔ Where you are ✔ Where you’re going ✔ How to fix the gaps 👉 Book your session now